Infographics
Various Companies
Created dozens of informational graphics representing data in a visual pleasing, easy-to-read formats.
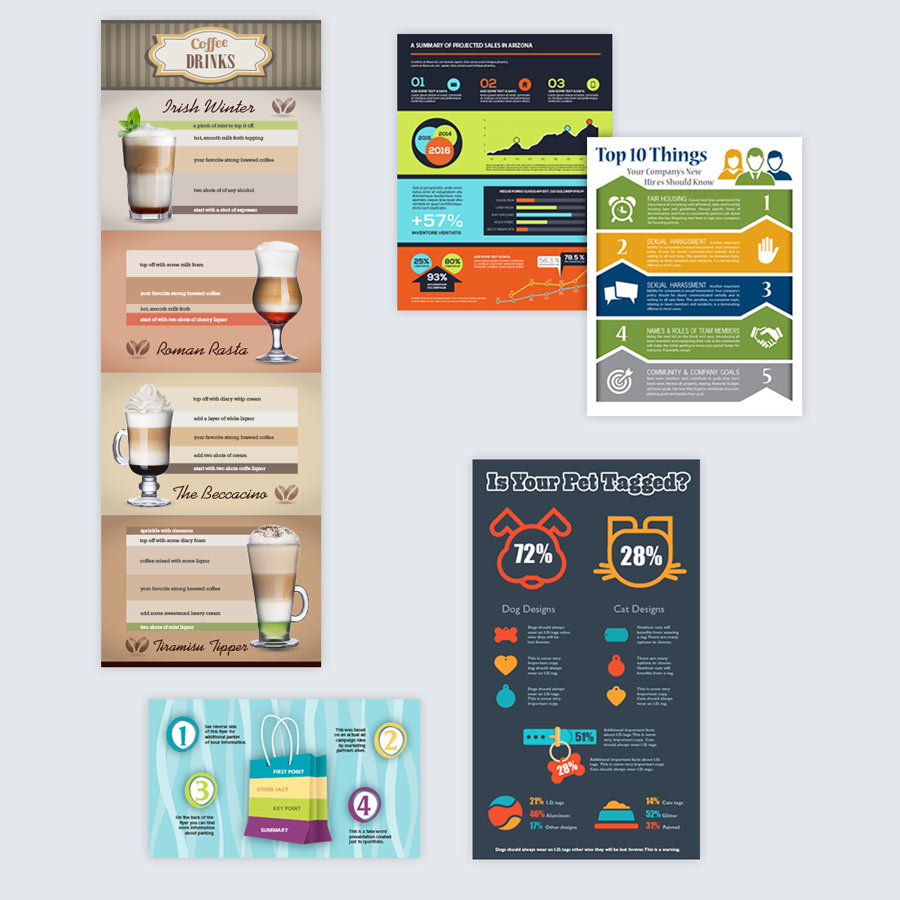
SLIDE ONE
TOP LEFT: Infographic with coffee drink recipes. TOP CENTER: Key data from an annual report converted to a sales sheet. TOP RIGHT: Side one of copy heavy infographic. BOTTOM LEFT: Shopping bag graphic chart. BOTTOM RIGHT: Colorful poster with pet tag information.
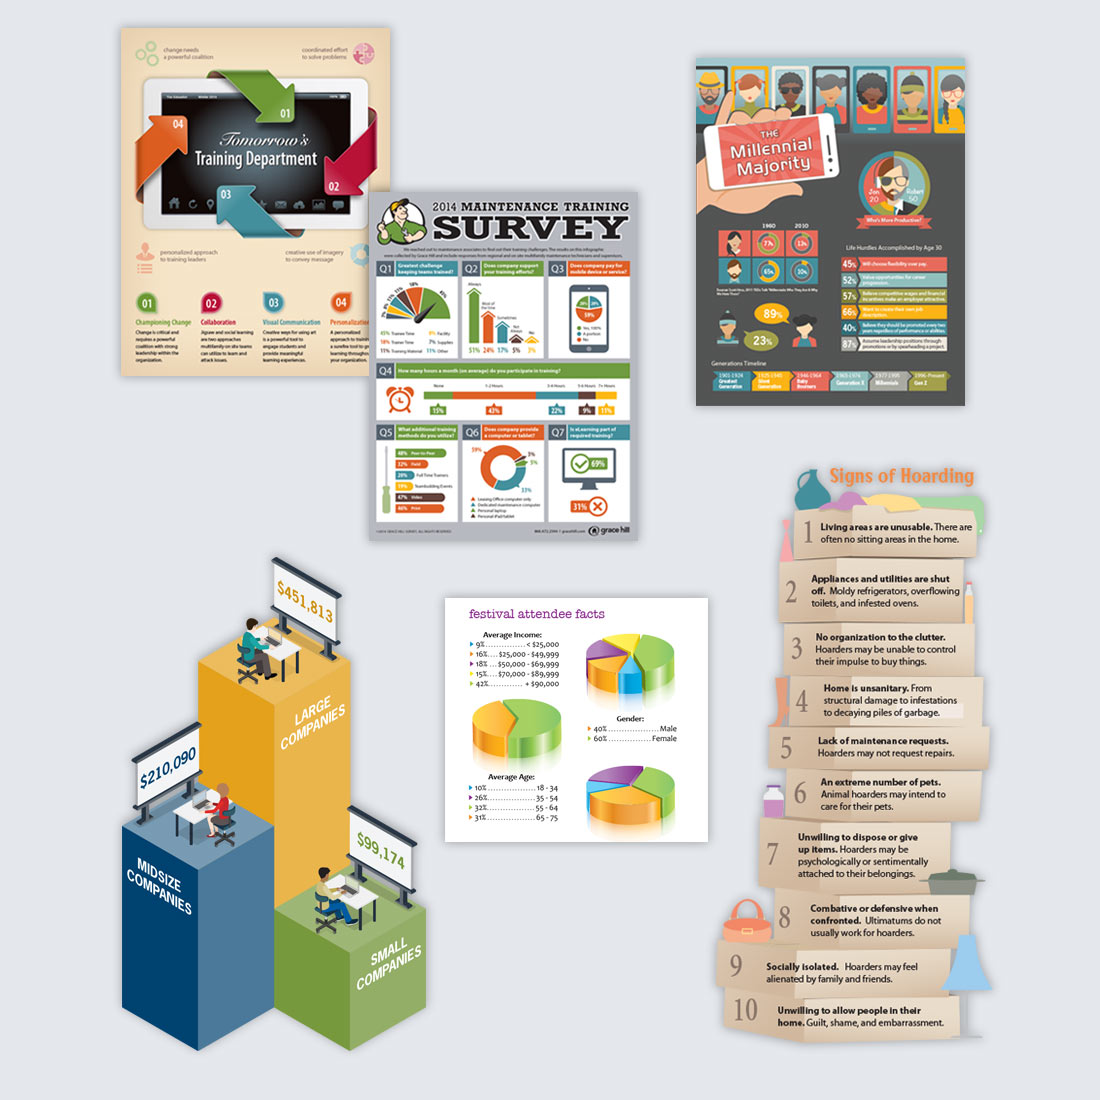
SLIDE TWO
TOP LEFT: Infographic highlighting eLearning information. TOP CENTER: Data-heavy survey converted to easy-to-read graphics. TOP RIGHT: Infographic of millennial data designed for magazine article. BOTTOM CENTER: 3D graphs of film festival attendance. BOTTOM LEFT: Isometric graphic illustration with office working characters. BOTTOM RIGHT: Hoarding editorial graphic.